


Hoşgeldiniz
Cozy Burger & Steak
“Birçok yerde burger yemiş olabilirsiniz fakat lezzeti, tadı, tuzu, acısı, sunum ile Cozy burger size daha farklı bir yemek deneyimi sunuyor. Yaptığımız her burger de aynı lezzeti yakalamak için ciddi bir lezzet bombası yaratarak damak tadınızı arttırmaya çalışıyoruz.”
Adana'nın en etkileyici ağızda tat bırakan, heyecan verici burger ve steak deneyiminize hoş geldiniz. Hamburger öyle herkesin yapabileceği iş değil işin içine biz varsak %100 dana eti ve özel soslarımız ile muhteşem lezzetleri sizlere cozy burger olarak sunuyoruz. Cozy burger olarak ilk baştan ve şuan da devam eden süreçte her zaman müşteri memnuniyeti ön planımızda oldu. Bu kararlılığımızla birlikte yaptığımız sayısız burgerler ile hep insanları mutlu ve karnı doymuş bir biçimde gönderdik. Yani sonuç olarak Adana da bir burger ya da steak ner de yenir? sorusunun cevabı tabiki Cozy Burger olacaktır.
Benzersiz
Menü
Yıllar boyunca burger üzerine edindiğimiz tecrübeler sonucunda oluşturduğumuz Burgerlar de lezzetin yanında sunum şeklimize de yenilikler getirerek sizlerin daha iyi bir burger yemenin zevkini tattırıyoruz. Ayrıca sadece burger de iyi olduğumuz kadar diğer tadlarımızı denemelisiniz, salata çeşitlerimiz, Hot dog, Sandiviçler ve speciallerimiz ile müşterilerimize sunuyoruz. Cozy burger de keyifli menülerimizin keyfini çıkaramaya hazırmısınız?
Burger & Steak
Eşsiz Lezzetler
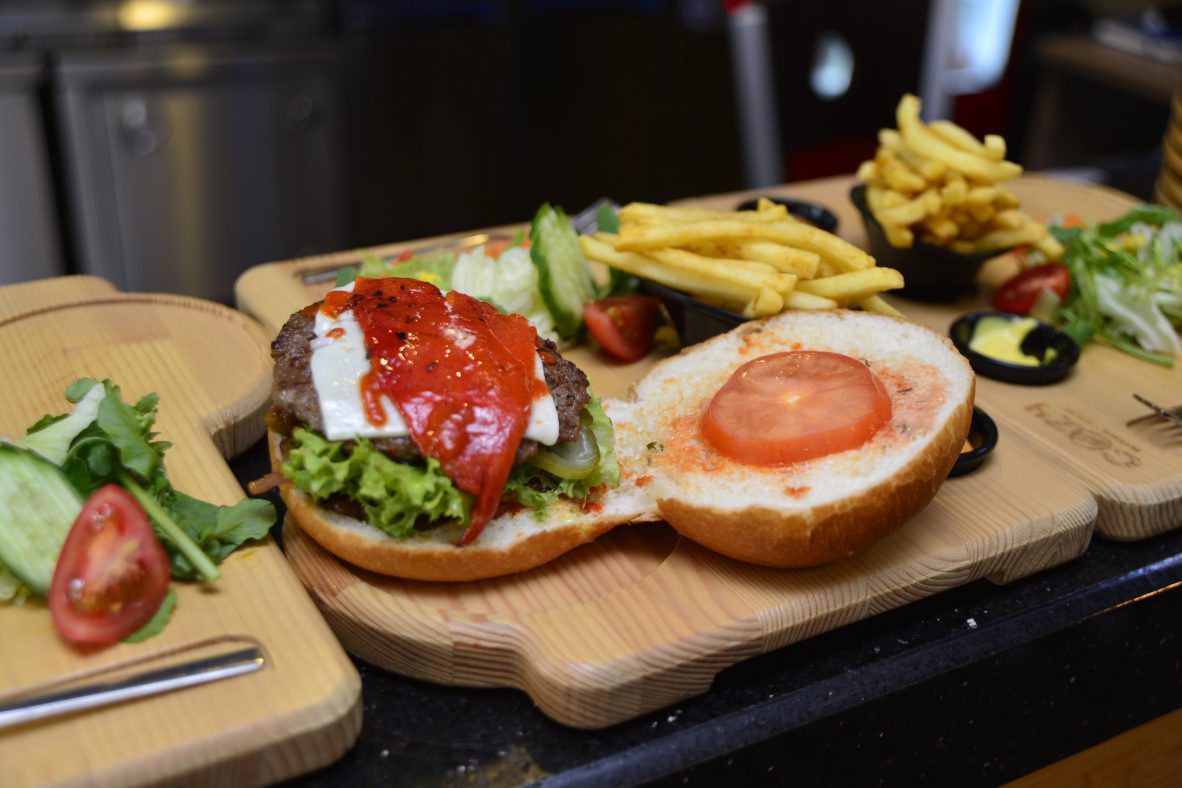
İşimiz Burger, gerek sunum şekliyle gerek lezzet ve damak tadıyla farklılık yaratan Cozy burger, lezzet ve damak tadını her zaman korumaya ve geliştirmeye devam etmektedir. Cozy bancon burger ile Cozy burger' de en çok tercih edilen ve speciallerimiz arasında dır.
Kaliteli servisi ile arıtılmış lezzetlerin peşindeki yerli ve yabancı misafirlerin popüler seçimidir. Eşşiz burger lezzetlerle hizmet verdiğimiz Cozy Buger haftanın yedi günü, öğle ve akşam servisimiz açıktır. En iyi burger lezzetini bizimle çıkarın
Cozy Burger & Steak
Lezzet Ellerinizin Arasında..
Şefimizin size özel lezzetleri
Cozy Burger & Steak
Duyurular
"Birbirinden farklı özel burger lezzetini bizimle tatmak ister misiniz? Özel sunumumuz soslar ve burger & steak konusunda en iyi lezzeti, %100 et deneyimini Cozy Burger de tadın"
CozyBurger
"Burger yaparken her zaman taze ve günlük olması lazım. Cozy Burger olarak işini bilen kişilerle birlikte günlük olarak taze bir lezzet sunuyoruz."
CozyBurger
"Anne eli değmiş gibi cozy bacon,en düşük kalorili salataları,mis gibi ızgaralarıyla Adana'da en iyi burgerhouse kültürünü bir araya getiren Cozy burger farkı ile fiyat ve kalitemiz her zaman beğeni konusu olmuştur"